 This is the fourth and final post in our series exploring all the ways that adding call-backs to your call center can increase revenue or decrease costs. Here are links to the earlier posts: Part 1: Reducing Abandon Rates, Part 2: Decreasing Handle Time, and Part 3: Reducing Telco Cost. We also had a short post on Erlang calculations (Part 3.5) that’s worth reading if you need a refresher on that topic, since we’ll be using it in this post.
Although we are focusing exclusively on “hard” ROI, one should not discount the value of the increased customer satisfaction that results when you remove the aggravation of hold time. (If you need a reminder of how much callers dislike waiting on hold, just take a moment to scan the tweets at onholdwith.com.)
Today’s post will look at how call-backs can redistribute call traffic in time. This is a very powerful effect, but also the trickiest to illustrate. We can’t tell the story by tracking a single metric, like abandon rate. Instead, we have to build a scenario and watch how changing call volume throughout the day impacts service levels and agent efficiency.
Let’s get started!
The Trouble with Spikes
Many call centers have peaks in their call volume as a result of holidays, bad weather, special promotions, etc. “Spikey” traffic degrades the customer experience and drags down key performance metrics. When agents can’t keep up with calls, the Average Speed to Answer (ASA) grows. That drives up the abandonment rate, as callers get tired of waiting on hold. Long wait times also lead to frustrated customers who then take out their anger on the agents, raising average handle time and lowering agent morale.
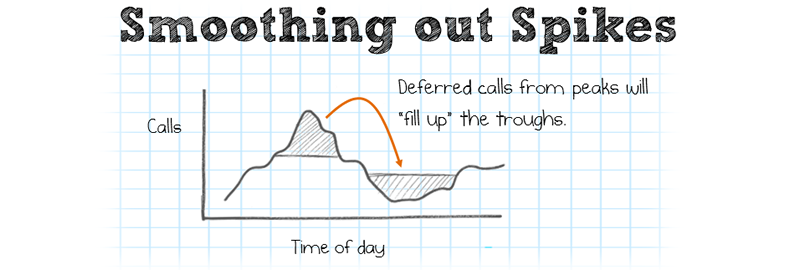
Call center managers usually don’t want to staff up to cover the peak levels, because that would leave excess agent capacity during off-peak days. This is where call-backs can help. If you have a deficit in agent capacity during one period, but a surplus during another, you can use call-backs to defer calls until a later time. The basic effect is “smoothing out” of the call traffic.
Figure 1
Setting up the Example
The concept shown in Figure 1 makes sense intuitively, but in order to get to quantitative answers, we need to bring in Erlang calculations. (For a refresher on this topic, see our post “Erlang in a Nutshell“.)
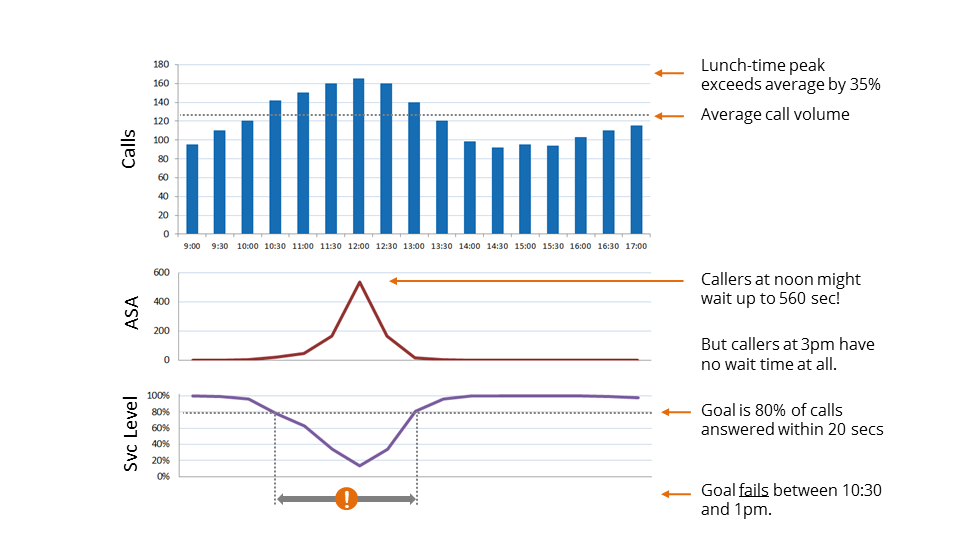
Let’s turn again to the example company we’ve been using throughout this series, creatively named “ExampleCo”. It has 28 agents, handling 500,000 calls per year, with an average handle time of 5 minutes and a target service level of 80/20 (i.e. 80% of calls should be answered in 20 minutes.)
If call traffic were perfectly smooth, there would be 250 calls coming in per hour and agents would be able to provide timely service. But ExampleCo has a surge of calls in the middle of the day and then a lull in the afternoon hours as you can see below. (Note that the graph is showing ½ hour timeslots so the average rate of calls is 125 rather than 250.)
During those lunchtime hours, ExampleCo is not able to meet its service level. In fact, ASA gets embarrassingly long. The company’s management wants the problem solved in a cost-effective way. One option being considered is hiring more agents. Later we’ll look at what that will cost. But first let’s look at using call-backs as an alternative solution and use the cost differential as our basis for ROI.
Figure 2
Scheduled Call-backs
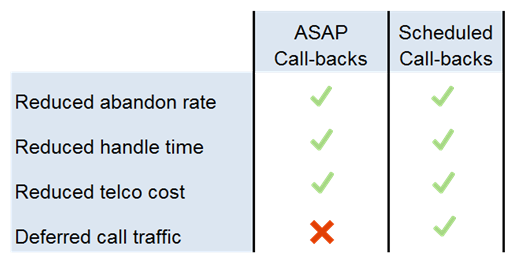
It’s important at this point to make the distinction between regular (or “ASAP”) call-backs and scheduled call-backs. Traditionally, with call-backs, the customer’s place in line is held and he is called when his turn arrives. Another name for this is “virtual queuing” because the caller is waiting in the queue via a virtual place holder. This approach yields the advantages of decreased abandonment, shorter handle times and lower telco costs, but it does not get us the traffic reshaping advantage we want. That’s because just replacing queue time with virtual queue time doesn’t change the burden on the call center. To do that you need scheduled call-backs, whereby customers are offered carefully selected time slots in the future for their call-back.
Figure 3
The Scheduling Interaction
Asking a caller to select a time slot at the time of their original call does add a small burden to the process. But fortunately, customers still regard this option favorably because they perceive that the call center is catering to their needs. It’s really a win-win situation.
If the interaction begins on the phone, the time slot selection can be done through an IVR-style menu. If the interaction begins on the web or mobile app, then the timeslot selection process can be even simpler, as shown in the figure below, taken from a Fonolo Web Rescue deployment.
Figure 4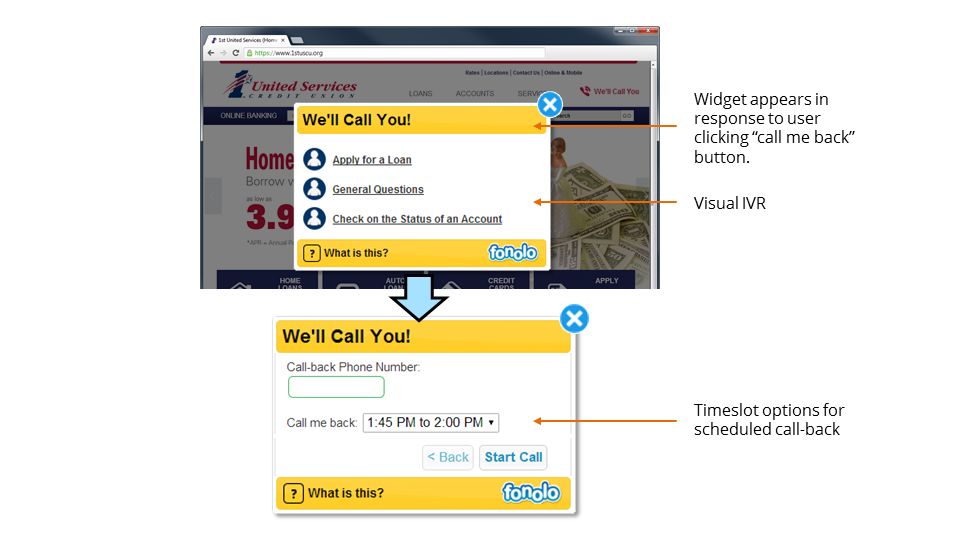
(Web Rescue is unique on the market in that it is a pre-built component with all the UI ready to go. Other call-back solutions on the market require building the interface with APIs.) Fonolo also offers a mobile call-back solution, Mobile Rescue, which offers similar functionality for embedding in mobile apps.
Taming the Peak with Call-Backs
For our call-back strategy, let’s start with something simple: Callers between 10:00 AM and 1:00 PM will hear an offer for a call-back, with suggested time slots between 2:00 PM and 4:30 PM. We’ll assume a 20% take rate and distribute those deferred calls evenly into the afternoon slots.
Figure 5
Already one can see that there are several powerful variables that you can control to reshape the call traffic to your needs:
- When are the call-backs offered?
- What time slots are proposed to the callers?
- What will be the Take-up Rate? (I.e. The percentage of callers who will opt for a call-back. This can be controlled by changing when and how often the offer message is played to callers who are in-queue. More on that in Part 1.)
When shopping for a call-back solution, make sure you have easy control of these variables!
Let’s see what the results are with the reshaped traffic.
Figure 6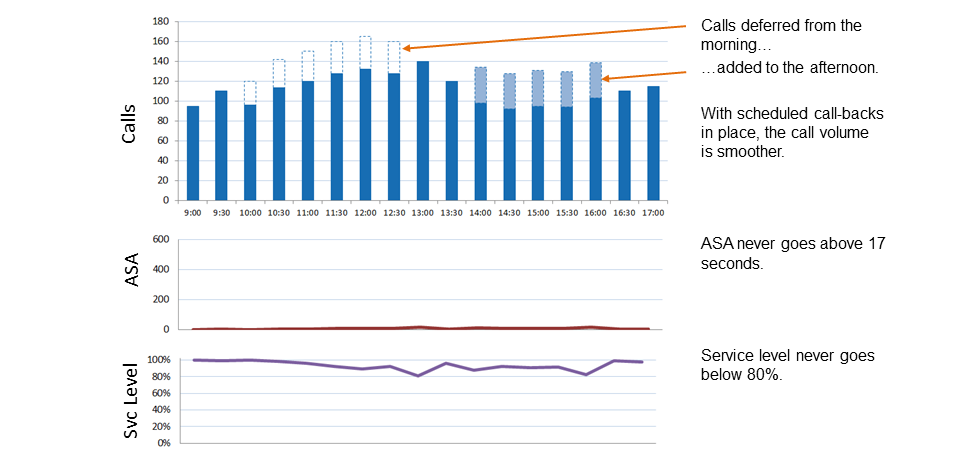
A great improvement! The service level is now met for 100% of the day and the ASA, which was peaking at 560 seconds (~9 minutes), now never goes above 17 seconds.
Hiring More Agents Instead
How many additional agents would it take to get a similar improvement? That’s really the question we need to answer in determining a ROI.
For the answer to that question, and the conclusion to this story, download our free eBook, The ROI of Call-Backs for Your Call Center, which combines all 4 parts of this series and exciting bonus material!
Discover the Contact Center Trends That Matter in 2024
Dig into industry trends and discover the changes that matter to your business in the year ahead.