It is critical to choose the right metrics to track in your contact center. Metrics drive your budget, the jobs of your agents and, of course, your company’s bottom line.
Today, we will look at “Average Call Time” also known as “Average Handle Time”. Its name is fairly self-explanatory, but there are important subtleties that need to be appreciated. Furthermore, we will look at the relative importance of this metric. If you’re tracking too many numbers, important signals can get lost in the noise so it’s important to prioritize. (TLDR: This one is not as important as many others.)
Measuring Average Handle Time (AHT)
Let’s start by defining AHT and its parts. Sometimes there’s overlap between the terms “talk time”, “handle time” and “call time”, depending on who you ask. The definitions below are very common, but not definitive.
Hopefully, you have a consensus within your call center! But be aware when talking to someone from another company you may need to sync-up your definitions first.
Handle time is the sum of 3 numbers (as shown below):
1. Talk time: The time an agent and caller spend talking to each other.
2. Hold time: The time a caller spends on hold, not including the initial hold time, when the caller had not yet reached the agent. In other words, “hold time” in this case only counts the seconds where an agent has put the caller on hold (usually to research a solution or confer with a colleague). You can call this “interstitial hold time” to distinguish it from the initial hold time. Another way to avoid confusion is to call the initial hold time the “queue time”, since that term is never used for the interstitial hold time.
3. Wrap-up time: The time an agent spends on post-call work after the conversation ends. It’s important to limit this to work that is directly related to the call, and exclude general non-call work.

1) Picking the Wrong Time Period
As with any call center metric that averages over time, the time period included in the average must be chosen carefully.
If you pick a time that is too long, you can mask important variability. Perhaps call duration spikes at lunchtime – if you average over the day you won’t notice that.
But if you pick a time period that is too short, you will end up with data that needs to be aggregated yet again before it can be useful. It is tempting to create an “average of averages” but the results can be misleading. For more on this read, “Why is an average of an average usually incorrect?” or “Is an Average of Averages Accurate? (Hint: NO!)”.
2) Ignoring Root Problems
AHT is popular for two reasons:
-
- It is easy to understand and measure
- It closely tracks cost-per-call
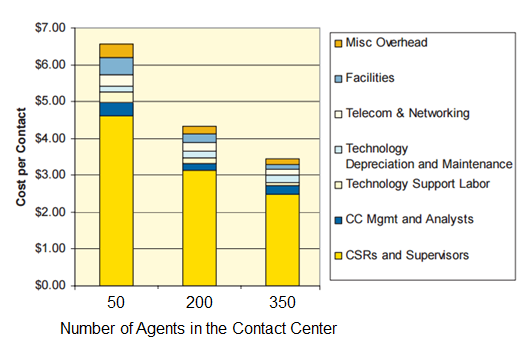
Since most call centers are very cost-conscious, reason two is very powerful. Variable labor costs are typically 80% of a call centers operating cost. If we take the average across those models, we see that the variable labor costs (“CSRs and Supervisors”) account for roughly 80%.
A research paper by Strategic Contact modeled 5 different kinds of call center situations and provides this helpful visualization. (Here’s the original report.)
The downside of this thinking is that the handle time of a call is an outcome. It is a result of multiple inputs such as business processes, technology choices, agent behavior, caller attitude, etc. This is a very broad range! Basically, any functional part of your call center could have an impact on handle time. Thus, setting the goal of a “lower handle time” is not an effective plan. It’s better to focus on fixing a more specific problem.
3) Misaligning Agent Incentives
Agent behavior is impacted dramatically by the metrics that management chooses to monitor. If agents are being graded on AHT, there is a risk they will rush through calls and not solve the problems. Many companies have found that de-emphasizing AHT will lead to increased customer satisfaction and first call resolution (FCR).
A great example of this trade-off can be seen in a webinar we did with Jeannie Sugaoka, Senior VP of Support Services, at Tech CU (Technology Credit Union). Watch it on-demand here.
Jeannie said,
We want our customers to feel cared for, and for every call to be ‘one-and-done’… so we don’t manage handle time.
This is one of those policy decisions that has powerful ramifications. The decision not to watch handle time sends a strong signal to the agents about how they should approach calls and the kind of style they should use. It’s no surprise that Tech CU enjoys a very high customer satisfaction score (C-SAT).
Conclusion
How are you using Average Handle Time in your call center? Have you found a creative way to avoid the pitfalls listed here? Have you found other pitfalls that we didn’t mention? We’d love to hear from you!

Discover the Contact Center Trends That Matter in 2024
Dig into industry trends and discover the changes that matter to your business in the year ahead.
