 At Fonolo, we’re always on the look-out for new industry research, studies, surveys and whitepapers. It’s the only way to stay current on the many aspects of the fast-moving contact center industry. No doubt you’ve noticed that the popularity of “content marketing” has resulted in a dramatic increase in the quantity of content from vendors, analysts and industry groups. Sadly, that’s made it hard to find the quality among all the fluff.
We’re here to help! Assembled below are 7 recent reports that we feel are worth your time. They feature original research and cover topics such as multi-channel trends, metrics, operational strategy, and much more. We are grateful to the authors (and sponsors) for all the insights and we’d like to pass along our recommendations to our loyal readers.
1) Executive Report on Contact Center Technology
Who wrote it: Call Center IQ
Where to get it: http://old.callcenter-iq.com/technology/white-papers/2016-executive-report-on-contact-center-technology
Intro:
“Featuring a combination of exclusive market research, in-depth commentary, and insightful case studies, this report reveals how contact center technology is evolving – and must continue to evolve – in this era of customer centricity. More importantly, it will empower you to leverage contact center technology to create a more efficient, more effective, more customer-centric engagement experience.”
Key findings:
- Today’s organizations are indeed moving to the cloud: twelve months ago, 80% primarily housed their contact center technology on premise. That number is down to 58% in the present, and it will fall to just 44% in the next twelve months.
- Decisions about contact center technology are most commonly made by C-level executives and IT departments. The contact center/ CX team guides these decisions in only 26% of organizations.
Our favorite chart:
This is a great visualization of the continued trend towards cloud and cloud-hybrid architectures for call centers.
2) The Inner Circle Guide to Omnichannel Customer Contact
Who wrote it: ContactBabel
Where to get it: http://www.contactbabel.com/reports.cfm
What it covers:
- Volume, growth and cost of digital channels, compared to voice calls
- The channels that customers prefer versus what they actually use, and why
- Detailed focus on specific channels, including: Email, Web Chat, SMS, Social Media, Self-Service (including Web Call-Backs, formerly known as Visual IVR)
- The effect of smartphones
- Web RTC & video
- Facebook Messenger & WhatsApp
Our favorite chart:
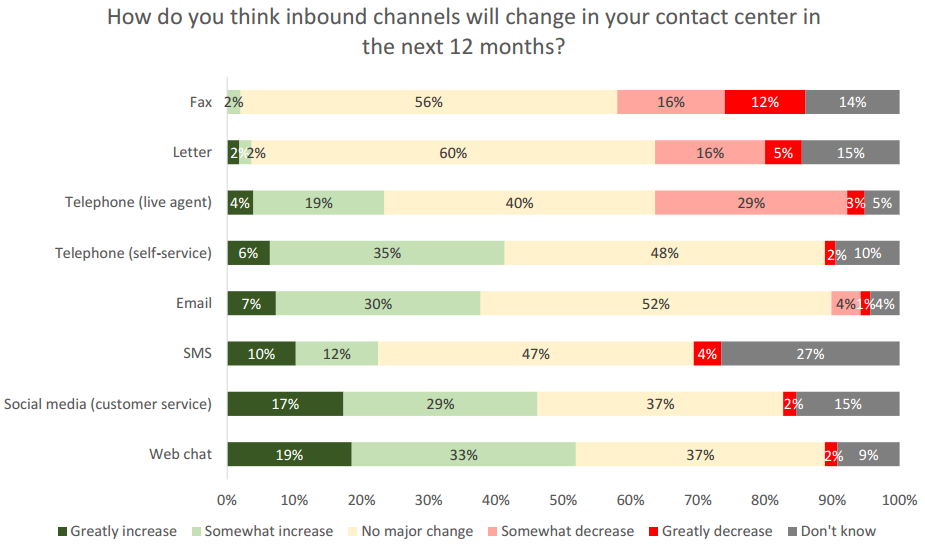
ContactBabel asked call centers how they expect the mix of inbound channels to change between now and 12 months in the future.
3) Global Contact Centre Benchmark
Who wrote it: Dimension Data
Where to get it: Here
Background:
This report is highly regarded because Dimension Data has been asking the same questions, with the same methodology, since 1997. Hence, it gives us a unique view into the evolution of customer service.
Key findings:
35% of all interactions are now on “digital” (i.e. non-voice) channels. They further predict “digital interactions will overtake voice by the end of 2016”.
Our favorite chart:
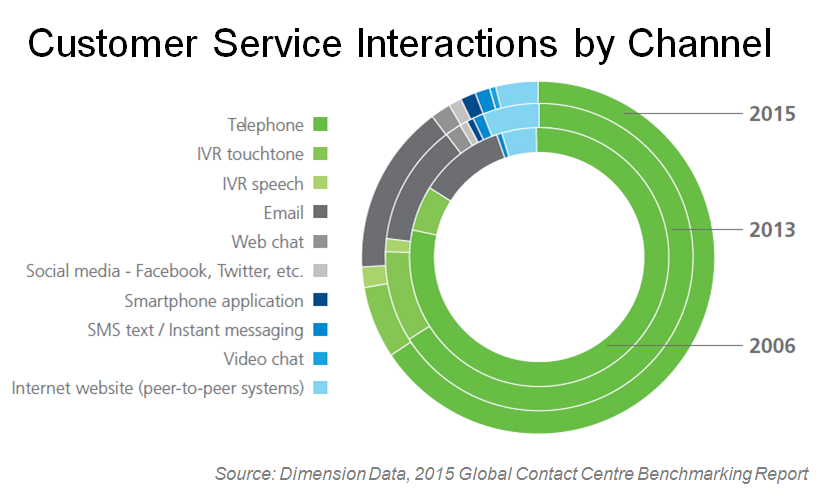
These nested pie charts show how the customer service channel mix has changed over the years.
4) Executive Report on Metrics, Agents and Operations
Who wrote it: Call Center IQ
Where to get it: http://old.callcenter-iq.com/call-center-management/white-papers/2016-executive-report-on-performance-metrics-agent/
What it covers:
- The top performance objectives for today’s contact centers – and the best metrics to use when evaluating success
- The most important factors when interacting with your customers
- The biggest inhibitors standing in the way of contact center excellence
- Game changing initiatives for conquering those challenges and achieving unparalleled results
- Urgent (and not-so-urgent) solutions for engaging – and empowering – your agents
Our favorite chart:
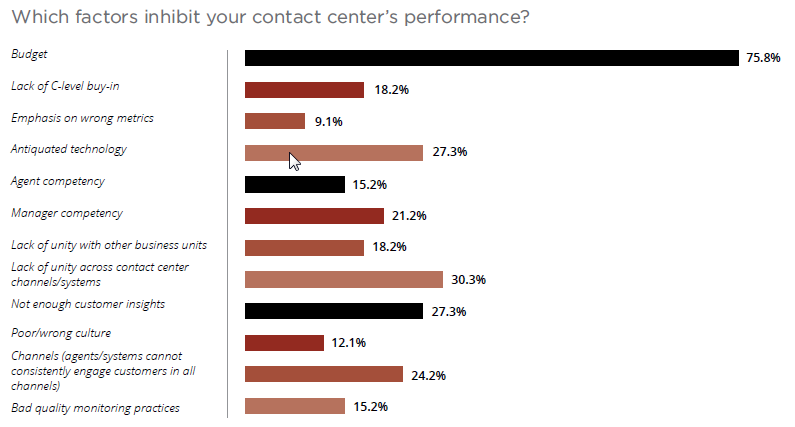
CCIQ asked the call centers in their survey which factors they felt were inhibiting their contact center’s performance the most.
5) The Future Of Customer Service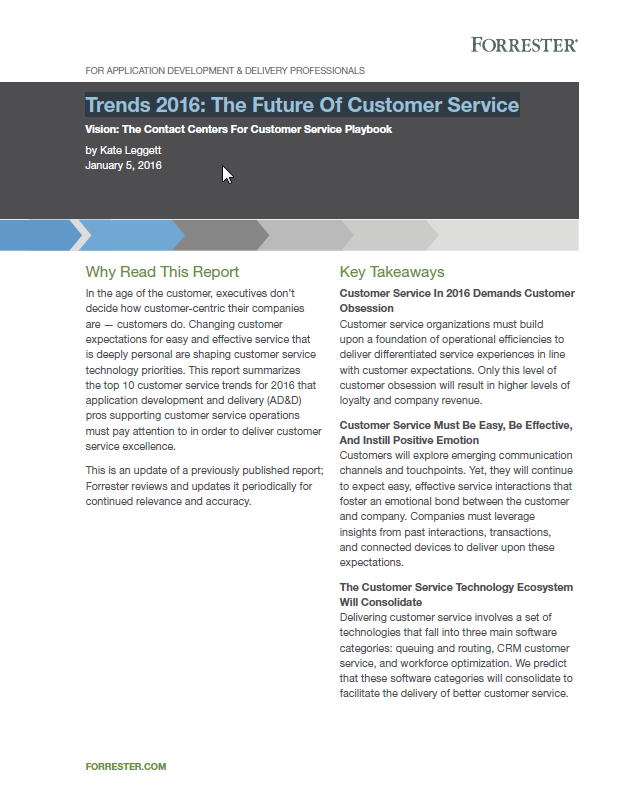
Who wrote it: Forrester / Kate Leggett
(Member of our Top Analysts Lists)
Where to get it: Here
(NOTE: This is a paid report)
What it covers:
“This report summarizes the top 10 customer service trends for 2016 that application development and delivery (AD&D) pros supporting customer service operations must pay attention to in order to deliver customer service excellence.”
Our favorite chart:
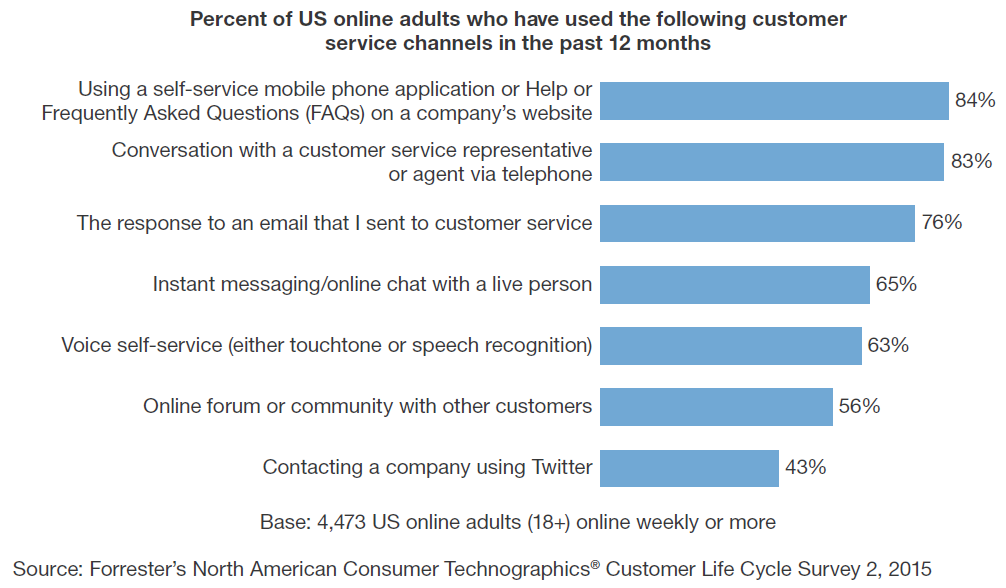
Based on a survey of 4473 US online adults, this chart shows which channels were used the most in the past 12 month period.
6) State of Multichannel Customer Service Report
 Who wrote it: Microsoft
Where to get it: Here
What it covers:
- What customers view as the most important aspects of a good customer experience
- Most frustrating aspects of a poor customer experience
- Service expectations for self-service, social and mobile channels
- Importance of service in a customer’s choice of, or loyalty to a brand
- What percentage of customers leave a brand or organization due to a single poor customer experience
Key Findings:
- Consumers now regularly use at least four different channels when interacting with a brand or organization for customer-related questions and issues.
- In addition to the growing number of channels being used, channel preference is also changing based on the customer’s perceived value for time spent.
Our favorite chart:
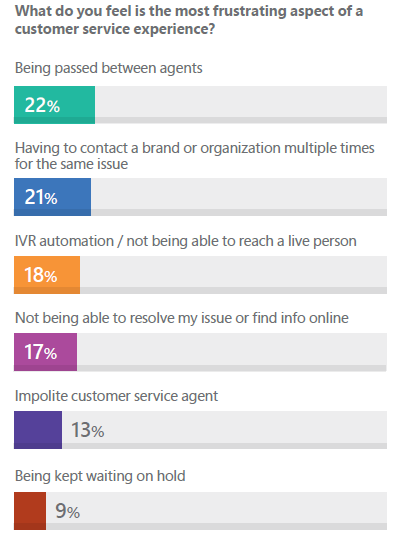
This chart shows what causes the most frustration to customers as part of the customer service process.
7) State of Service Report
Who wrote it: Salesforce
Where to get it: https://www.salesforce.com/form/conf/2015-state-of-service.jsp
What it covers: Based on a survey of 1,900 global customer service leaders, this report analyzed their responses to discover:
- The most common goals, obstacles, and success measures for today’s service teams
- What sets high-performing service organizations apart
- The areas in which service is supercharging efforts to grow business
Our favorite chart:
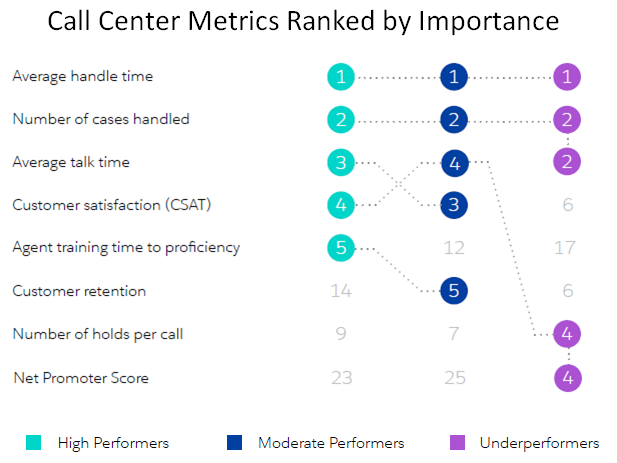
This is a unique view into how different call center leaders rank the importance of different metrics. It’s no surprise that “Average Handle Time” was ranked #1 across the board. (See our recent post 3 Pitfalls When Measuring Average Handle Time.) But it is interesting to see that only “underperformers” are ranking Net Promoter Score highly. Has this metric passed out of fashion? Hmm, maybe this is a topic for the next blog post!
How to Manage Call Spikes in the Contact Center
Download this free guide to learn how to protect your contact center from call spikes.


