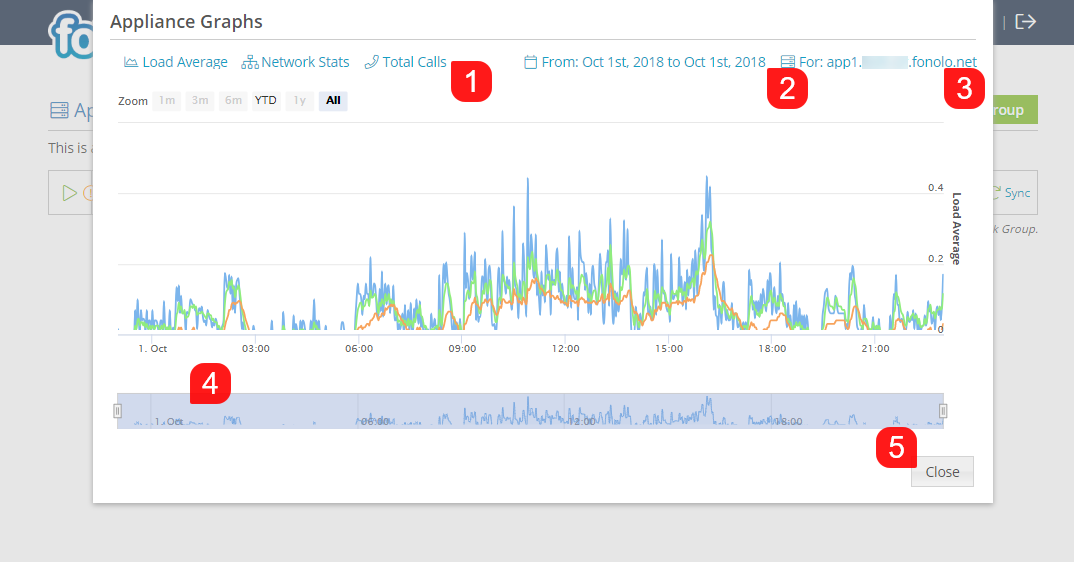
When examining Appliance Graphs, you can see statistics regarding the load and performance of the Fonolo Appliances. You are able to examine Load Average, Network Stats, and the number of Total Calls (1) that the Fonolo Appliances are handling in a given time span. You can adjust the time span that is displayed by clicking on the current date interval and adjusting it with the popup calendar you are presented with (2). Lastly, you can change which Fonolo Appliance that the graph will display data on (3).
To look at only a certain period of the day, adjust the left and right sliders in the second, smaller chart towards the bottom to focus on a period within the selected time span (4). When finished, click the grey ‘Close’ button (5) towards the bottom of the pop-up to close it and return to the previous page.