The Event History is where you can see a historical record of each time the Monitor was triggered to send a report to a specific Contact Group. When you click on the blue ‘Event History’ link, you will receive a pop-up with a graph and chart that together display a record of each time a Monitor is sent out.
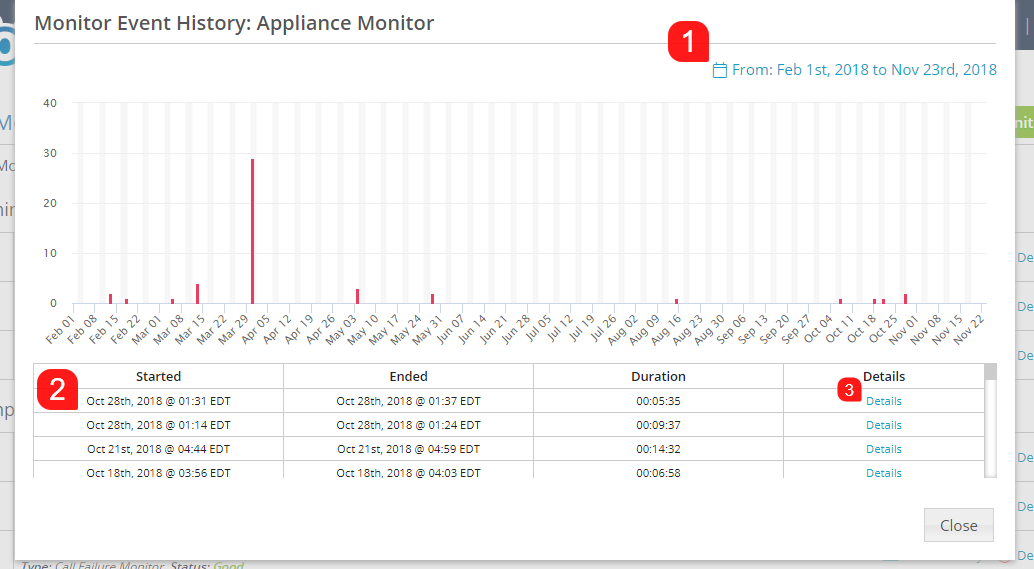
You can adjust the Timeframe that is displayed by clicking the Date Range (1) in the top right corner of the pop-up, and selecting different dates from the calendar selector. Below the graph will be a table displaying a list of all of the Events that triggered and sent out a Monitor Report (2). By clicking the blue ‘Details’ link (3) for a particular event, you will get another popup that will present detailed statistic on the event for further investigation.
The following screen capture provides an example of an event that triggered an Appliance Failure Monitor to be sent out. The data displayed includes the date and time of each failure event (1), the duration of the failure event (2), the total number of checks performed for this period (3), and finally, the details describing the failure event (4).
