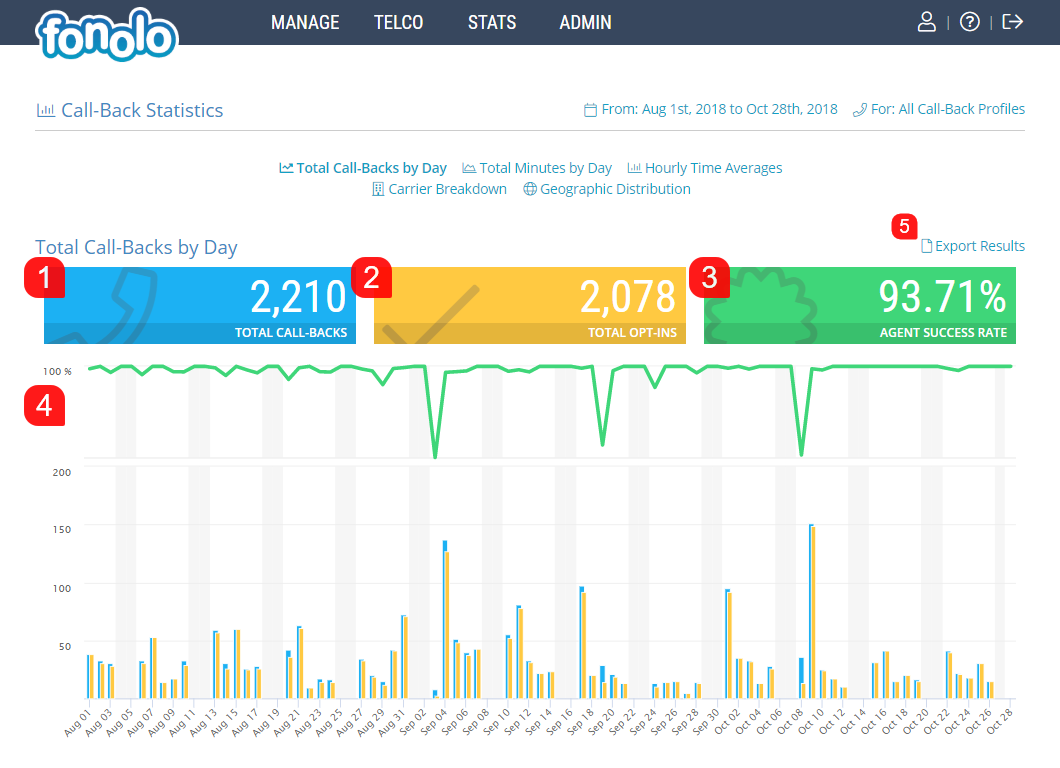
The Total Call-Backs by Day report will provide information on three key statistics:
Total Call-Backs (1) – This is the number of call-backs that were placed into Targets by Fonolo for the displayed date range
Total Opt-Ins (2) – This is the number of unique opt-ins that were requested by clients for the displayed date range
Agent Success Rate (3) – This is the success rate of the Agents pressing DTMF 1 to accept a Fonolo call-back
Total Opt-Ins will always be lower than the Total Call-Backs due to the fact that call-backs can sometimes be unsuccessful for various reasons, including:
- If the Client is busy and doesn’t answer;
- Network issues or PSTN issues;
- High call volume where your phone system is overloaded;
- No Agents logged in or available within the queue
The yellow bar in the graph represents the total Opt-Ins, the blue bar represents the Total Call-Backs, and the green represents the Agent Success Rate.
If you hover your mouse over any part of the data within the graph, you will see a small pop-up displaying additional data.
All of the information will be displayed at the same time in the graph towards the bottom of the page (4). To export the data into a CSV file, click the ‘Export Results’ button (5) in the top right corner of the page.