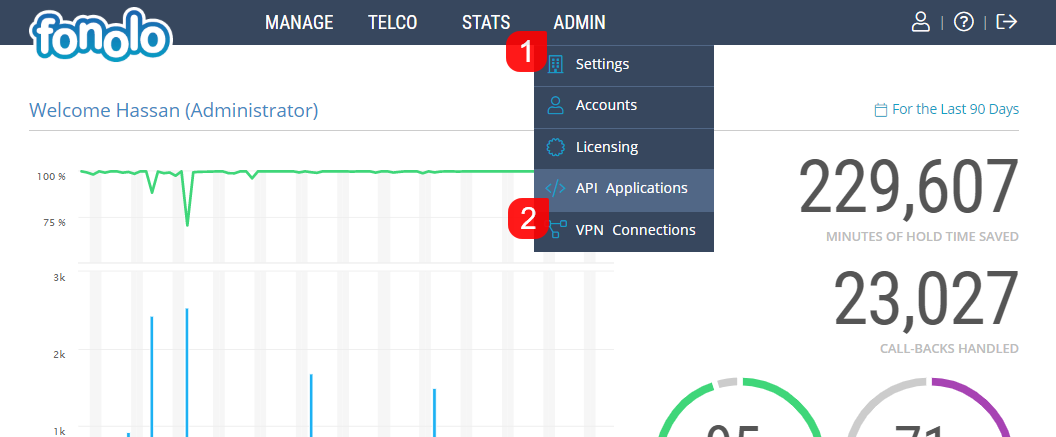
To view a graph of the number of API Requests over time for your API Applications, go to ADMIN (1) > API Applications (2).
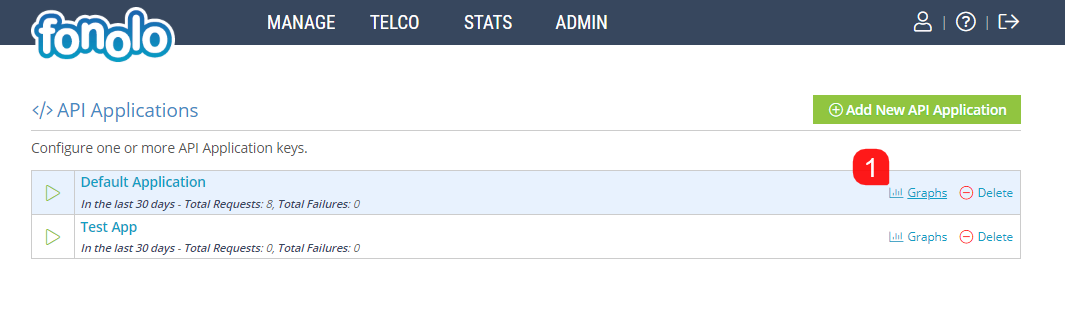
Next, click on the “Graph” (1) (shown below) icon for the relevant API Application
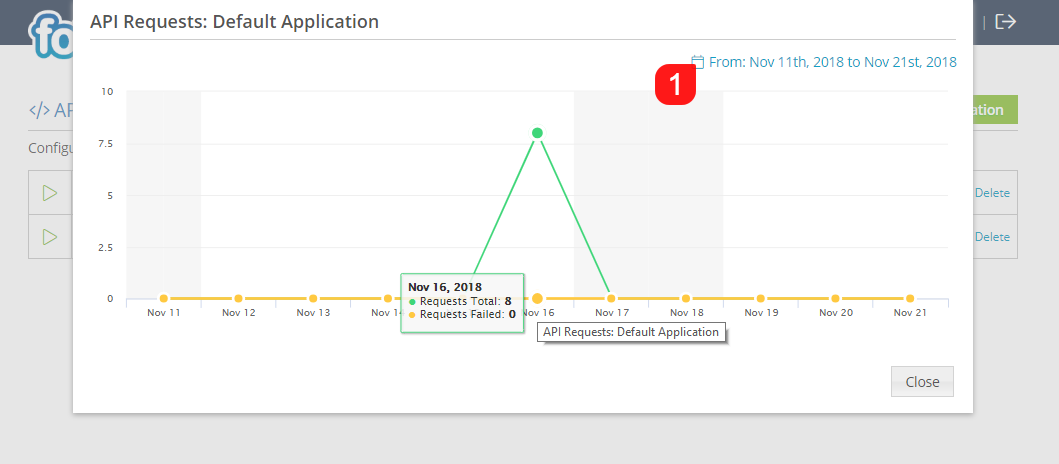
Finally, select the date range that you would like to view the information for by clicking the “Calendar” (1) icon (shown below) and selecting the relevant date range.