We’re in the middle of a series of posts exploring the ROI of adding call-backs to your call center. Each post looks at one of the paths to cost reduction or revenue lift. Part 1 looked at reducing abandon rates, Part 2 at decreasing handle time and Part 3 at reducing telco cost.
Part 4 (coming next week) will look at how call-backs can redistribute call traffic throughout the day to flatten spikes. This is a very powerful effect of call-backs, but also the most difficult to discuss and calculate. The benefit of redistributing calls can’t be measured by looking at a single variable, like “abandon rates”. Instead, you have to start by looking at how uneven call volume impacts service levels and contact center efficiency. Then, you can see the impact of shifting portions of the call volume to different parts of the day.
It’s impossible to examine this issue properly without a basic understanding of Erlang calculations. So before diving into Part 4, we’re going to take a short detour today (consider it “Part 3.5”) to demystify this topic.
Embrace the Erlang
There’s actually a “family” of Erlang equations that are useful for different aspects of call center planning. They are named after a Danish mathematician who invented the fields of traffic engineering and queuing theory in the early 1900’s. For more background, see the Wikipedia entry here. Today, we’re only concerned with “Erlang C” variant so I’m going to just call that “Erlang” throughout this post.
It’s understandable that many call center managers today are not comfortable with Erlang. It is often presented with complicated mathematical formulas which can be intimidating. Furthermore, today’s workforce management (WFM) systems obscure their inner Erlang engines behind elaborate user interfaces, meaning people using them don’t get a “feel” for what’s really going on inside.
Let’s try to fix that
Erlang is a Translator Box
Think of Erlang as a translator box, where you put in values like calls per hour, handle times, and the number of agents available. These are “deterministic” values, in that they are easily measured. What you get as an output are the answers to “probabilistic” questions such as, “What are the odds a call will have to wait in a queue?” or “What are the odds a call will wait more than 30 seconds?”
Figure 1:
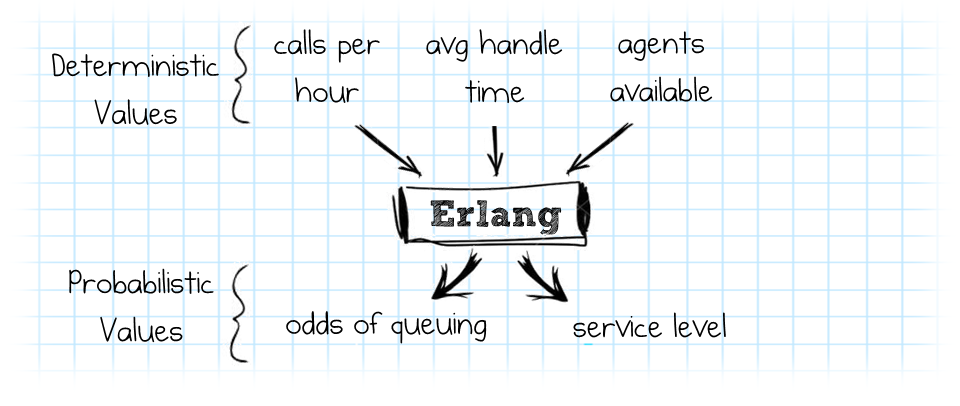
Getting the answer to that latter question is, of course, the key to calculating “Service Level”, which is a very common call center metric.
Figure 2: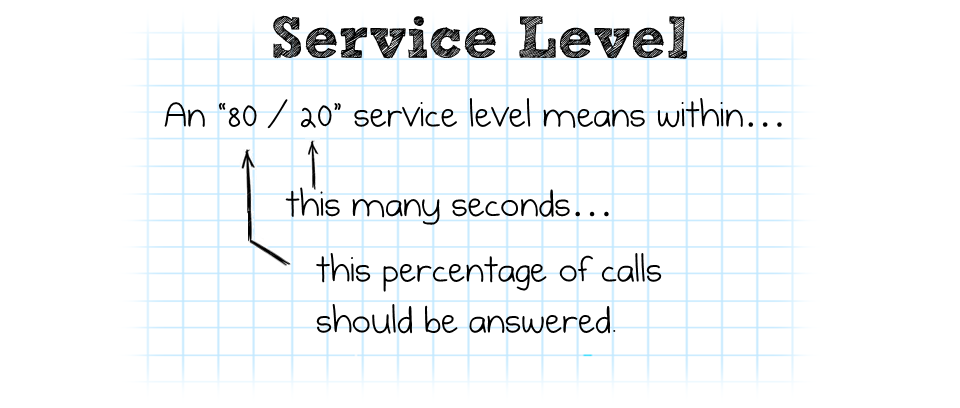
The translator box can also work in reverse, allowing us to answer questions like, “How many agents are needed to ensure an 80/20 service level?” Calculations like this are at the core of workforce management products.
A Quick Example
Let’s bring back “ExampleCo” from the earlier parts of this blog series. This company gets 500,000 calls per year and has an average handle time of 5 minutes. We’ll convert the calls per year to an hourly rate of 250 (based on 8 hours/day, 5 days/week, and 50 weeks/yr). And let’s add that there are 28 agents on staff.
Is ExampleCo able to meet its goal of an “80/20” service level? Erlang tells us yes.
Figure 3: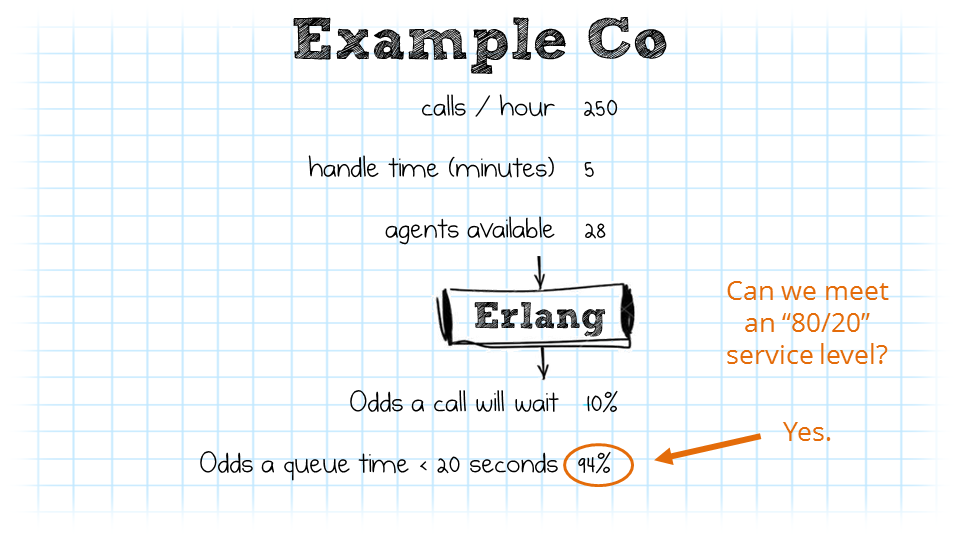
Do Try this at Home
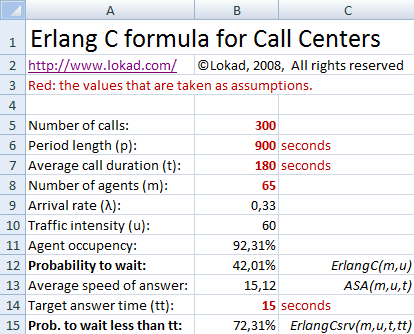
If you want to follow along with these examples, there are several free online Erlang calculators, such as this one from Erlang.com.
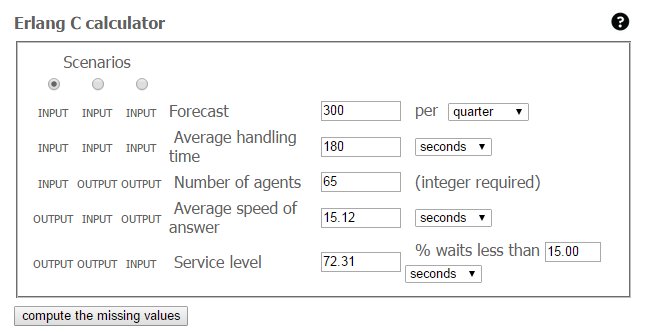
Or if you are handy with Excel, you can download macros that let you experiment with the variables in any way you like.
Getting more Realistic
We saw in Figure 3 that our example company can meet its service level, but there’s a big caveat: We assumed all hours have constant call volume and staffing level which, of course, is never true in the real world.
If we run the calculations again but with just three agents are missing, odds that a call will be answered in 20 seconds drops from 94% to 78%. Or if we get 300 calls instead of 250 in one hour (with full staff), only 62% of calls will be answered during our time goal.
At 330 calls/hour the agents will be fully occupied with calls. If we exceed that, the call center will be under-staffed and some calls won’t be answered within the hour. If this condition continues for several hours, we may get to the point where calls won’t be answered before the day ends.
As you can see, when call volume or staffing is uneven, things can get messy. One approach to compensate is to overstaff. (ExampleCo is definitely playing it close to the edge with only 28 agents.) Another approach is to use call-backs to redistribute and smooth out call volume. That’s what we will explore in Part 4 next week. Now that we’re armed with the power of Erlang, we can go through that process and get proper quantitative answers.

Discover the Contact Center Trends That Matter in 2024
Dig into industry trends and discover the changes that matter to your business in the year ahead.